
Peptide Purity Testing Methods

Updated: Oct 1

Selecting a research peptide without understanding how its purity was measured is a methodological risk that compounds at every stage of an experiment. Peptide purity testing methods determine whether the molecule you're dosing, binding, or injecting is what the label says it is, and at what concentration. For any scientifically literate buyer, understanding the analytical techniques behind a Certificate of Analysis (COA) is not optional background reading; it is the foundation of reproducible research.
Why Peptide Purity Testing Methods Matter Before You Order
Impure peptides introduce silent variables. A batch that is 88% target peptide carries 12% of something else, truncated sequences, deletion products, oxidised side chains, or residual reagents. In a dose-response assay, those contaminants shift EC50 values. In a cell-based study, they trigger off-target biological responses. In animal pharmacology, they become a confound that peer reviewers will correctly flag.
Research budgets are a practical constraint too. Repeating an in-vivo study because a peptide batch was insufficiently characterised costs far more than the price difference between a ≥95% and a ≥98% purity grade. Purity verification is therefore a cost-control measure, not just a quality signal.
HPLC, mass spectrometry, and amino acid analysis each answer a different question about peptide quality. Understanding what each one tells you, and what it cannot, is the framework this article provides.
HPLC Peptide Purity: The Industry Baseline
HPLC peptide purity is the most widely reported quality metric in synthetic peptide supply. Almost every COA you receive will lead with it. It is the right starting point, but it is not the complete picture.
How Reverse Phase HPLC Peptides Are Analysed
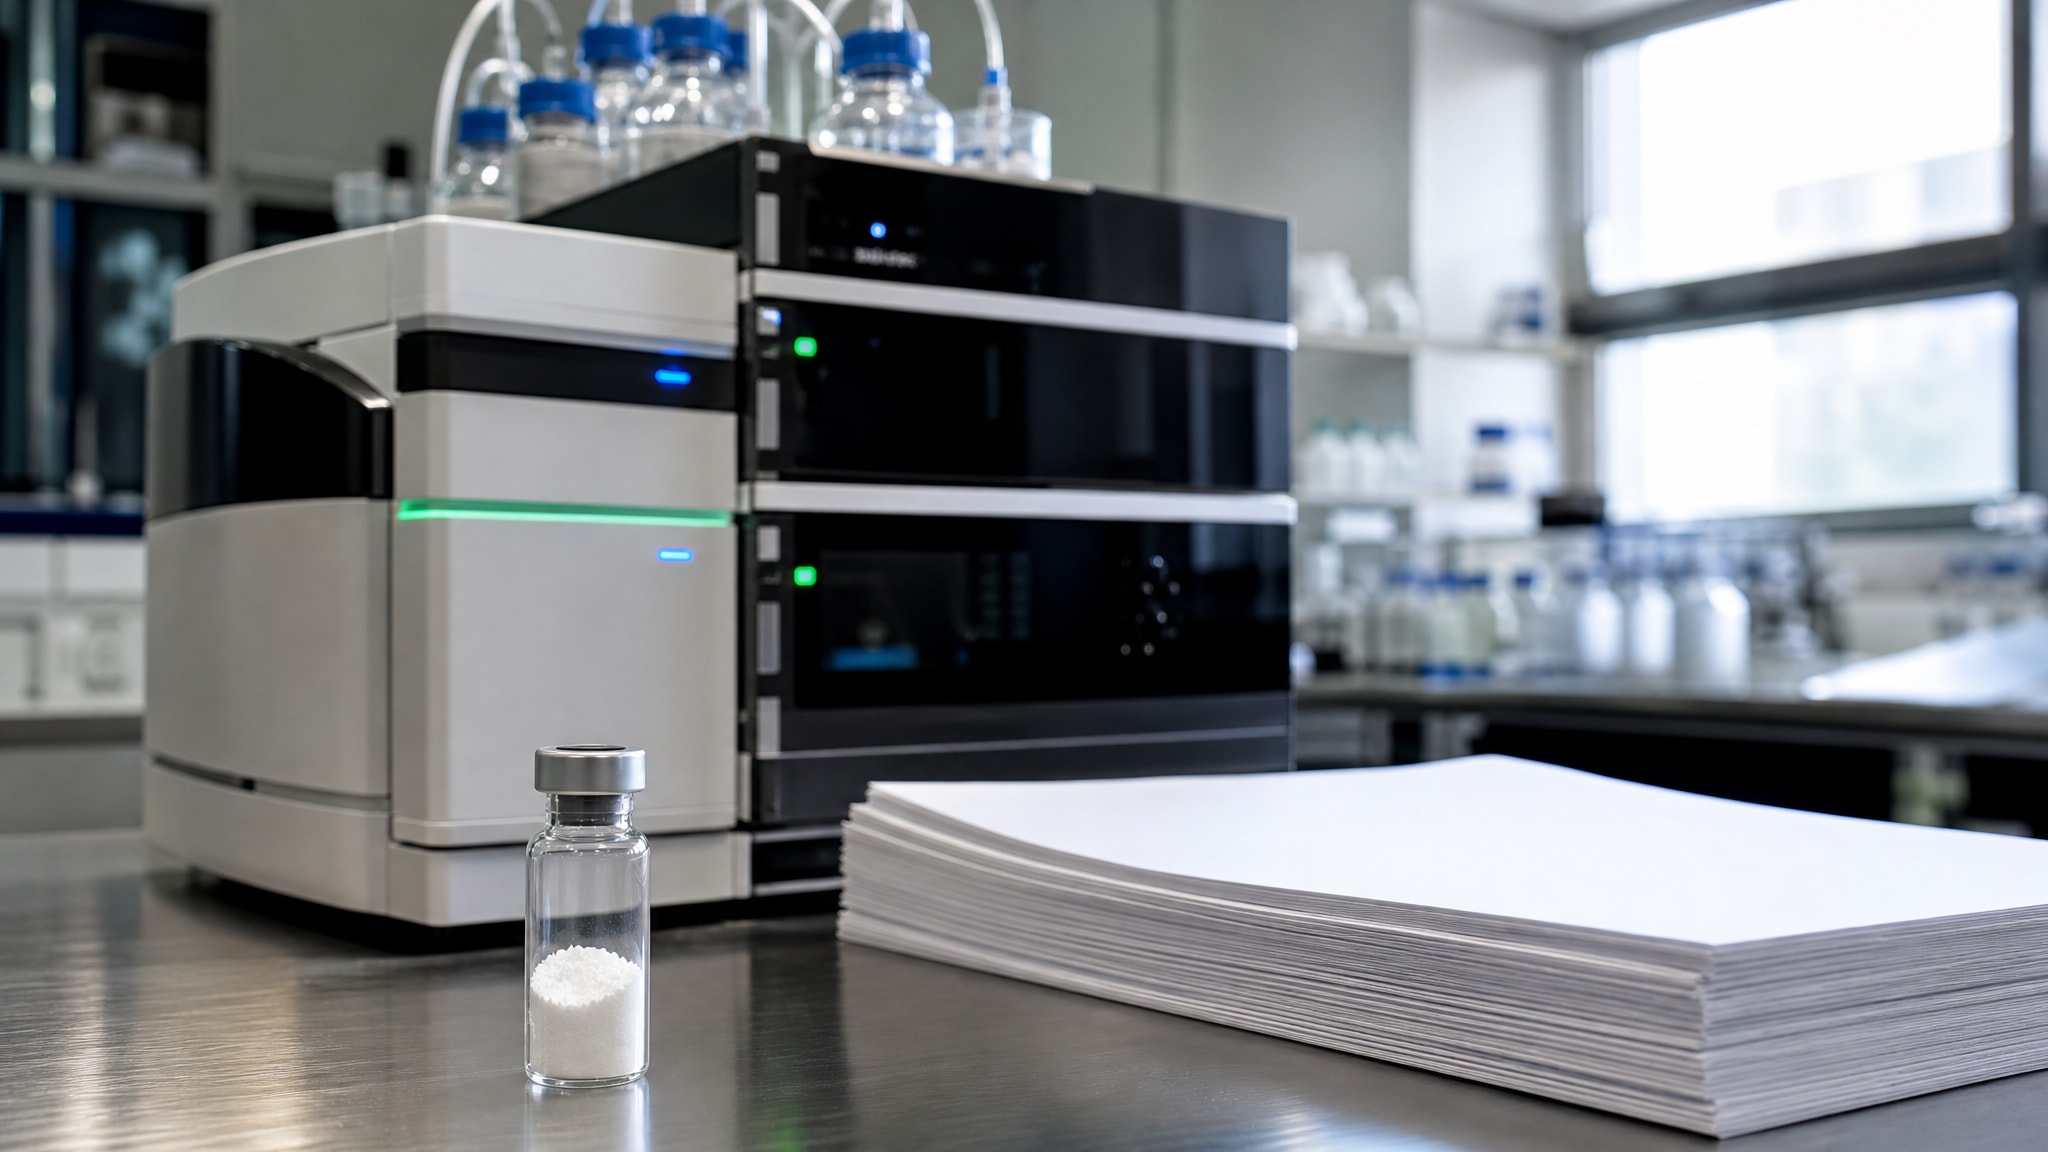
Reverse phase HPLC separates peptides by hydrophobicity. The stationary phase is non-polar (typically a C18 alkyl silica column), and the mobile phase is an aqueous/organic gradient, commonly water and acetonitrile with trifluoroacetic acid as an ion-pairing agent. More hydrophobic species elute later; more polar species elute earlier.
Detection is typically set at 214 nm, a wavelength that detects the peptide bond backbone directly, regardless of amino acid composition. This makes 214 nm detection compositionally neutral: every peptide-bond-containing species in the sample contributes to the signal, not just those with UV-absorbing side chains.
Purity is calculated as the area-under-the-curve for the target peptide peak, expressed as a percentage of total peak area across the chromatogram. That calculation assumes all detectable species respond equally at 214 nm, which is a reasonable approximation for most synthetic peptides.
Reading a Purity Percentage on a COA
A purity of ≥95% means the target peak accounts for at least 95% of total integrated peak area. The remaining ≤5% is distributed among impurity peaks, which may be truncated sequences, epimers, or oxidation products.
For routine screening or binding assays, ≥95% is a widely accepted threshold. For cell-based or in-vivo work, ≥98% is the more defensible standard, because the absolute mass of contaminants scales with dose, and higher doses magnify the effect of impurities.
HPLC alone cannot confirm molecular identity. A peak at the right retention time with the right area percentage tells you a species is present in high relative abundance. It does not confirm that species has the correct molecular mass or the correct sequence. That confirmation requires mass spectrometry.
Mass Spectrometry Peptide Verification: Confirming Molecular Identity
Mass spectrometry answers the identity question that HPLC cannot. Where HPLC reports relative abundance, MS reports molecular mass, and a correctly synthesised peptide has a precisely calculable theoretical mass based on its sequence.
A batch reporting 97% HPLC purity with no accompanying MS data could contain the correct abundance of a truncated or scrambled sequence, an error invisible to chromatography but immediately apparent on an electrospray mass spectrum. This is not a theoretical edge case; it is a failure mode that any analytical chemist in peptide QC will recognise. HPLC purity is a necessary but not sufficient quality measure. Molecular identity must be independently confirmed by mass spectrometry before a batch is fully characterised.
ESI-MS vs. MALDI-TOF: Which Method and When
Electrospray ionisation mass spectrometry (ESI-MS) introduces the peptide in solution and generates multiply-charged ions, which allows accurate mass determination across a wide molecular weight range. It is well-suited to smaller synthetic peptides (roughly up to 5,000 Da) and integrates naturally into LC-MS workflows where chromatographic separation and mass confirmation happen in a single analytical run.
MALDI-TOF (matrix-assisted laser desorption/ionisation time-of-flight) ionises the peptide from a solid matrix using a laser pulse, producing predominantly singly-charged ions. It is faster per sample, tolerates salt contamination better than ESI-MS, and is widely used for high-throughput QC screening of peptide batches. For larger peptides or complex mixtures where charge-state assignment becomes ambiguous, MALDI-TOF offers a cleaner readout.
For most research peptide buyers, the distinction matters less than confirming that some form of MS data is present on the COA. A [M+H]⁺ ion or a multiply-charged ESI spectrum that matches the theoretical mass within ±0.5 Da is the confirmation you need. Without that data, molecular identity is unverified.
Amino Acid Analysis and Complementary Peptide Analytical Testing
Amino acid analysis (AAA) goes beyond identity and relative purity to address absolute composition and quantity. The peptide is hydrolysed to its constituent amino acids, which are then separated and quantified, typically by HPLC after derivatisation with a fluorescent or UV-active reagent.
AAA confirms two things HPLC and MS do not: that the amino acid ratios match the target sequence, and that the absolute molar amount of peptide in the pre-filled pen is accurately known. The second point matters in in-vitro assays where researchers prepare solutions at defined molar concentrations. A peptide that is nominally 1 mg may carry significant water content or counter-ion mass (particularly trifluoroacetate, TFA, from HPLC purification), meaning the actual molar content is lower than the label weight implies.
This is where complementary analytical testing closes the gap. TFA counter-ion quantification establishes how much of the reported mass is salt rather than peptide. Water content measured by Karl Fischer titration accounts for hygroscopic moisture. Together with AAA, these methods give researchers the precise molarity needed for quantitative pharmacology, enzyme kinetics, or receptor binding studies.
For routine screening work, AAA is rarely necessary. For highly quantitative assays, kinetic studies, absolute IC50 determination, or calibration standards, it removes ambiguity from solution preparation.
Choosing the Right Purity Standard for Your Research
The practical question is not which method is most rigorous in the abstract, but which combination is adequate for a specific application. Over-specifying wastes budget; under-specifying wastes experiments.
Matching Purity Grade to Application: Cell Assays, Animal Studies, and Binding Screens
Routine binding and screening assays (e.g. competitive radioligand binding, initial target validation): ≥95% HPLC purity is generally acceptable. The signal-to-noise requirements at screening concentrations are forgiving enough that low-level impurities rarely confound the primary readout. MS confirmation is still advisable to rule out gross synthesis failures.
Cell-based assays (cytotoxicity, receptor internalisation, signalling pathway studies): ≥98% HPLC purity plus ESI-MS confirmation. Cells are sensitive to cytotoxic impurities at concentrations that would be invisible in a binding screen. Truncation products can exhibit partial agonism or antagonism, producing false activity profiles.
In-vivo rodent pharmacology: Many academic core facilities require a minimum of 95% HPLC purity with ESI-MS confirmation as a gate criterion before accepting externally sourced peptides into their protocols. For studies targeting publication or regulatory submission, ≥98% plus MS is the more defensible standard. Residual TFA is itself a biological variable in animal studies, making counter-ion testing a practical addition.
Quantitative biochemical assays (enzyme kinetics, Kd determination, calibration standards): Add AAA to the above. The absolute molar accuracy it provides is not a luxury in these applications; it is a prerequisite for the result to be interpretable.
If you are choosing a research peptide supplier in the GCC, use this decision matrix as a filter: any supplier who cannot supply purity data matching the tier your application requires is not the right supplier for that experiment.
What a COA Documentation Should Include: Peptide Quality Assurance in Practice
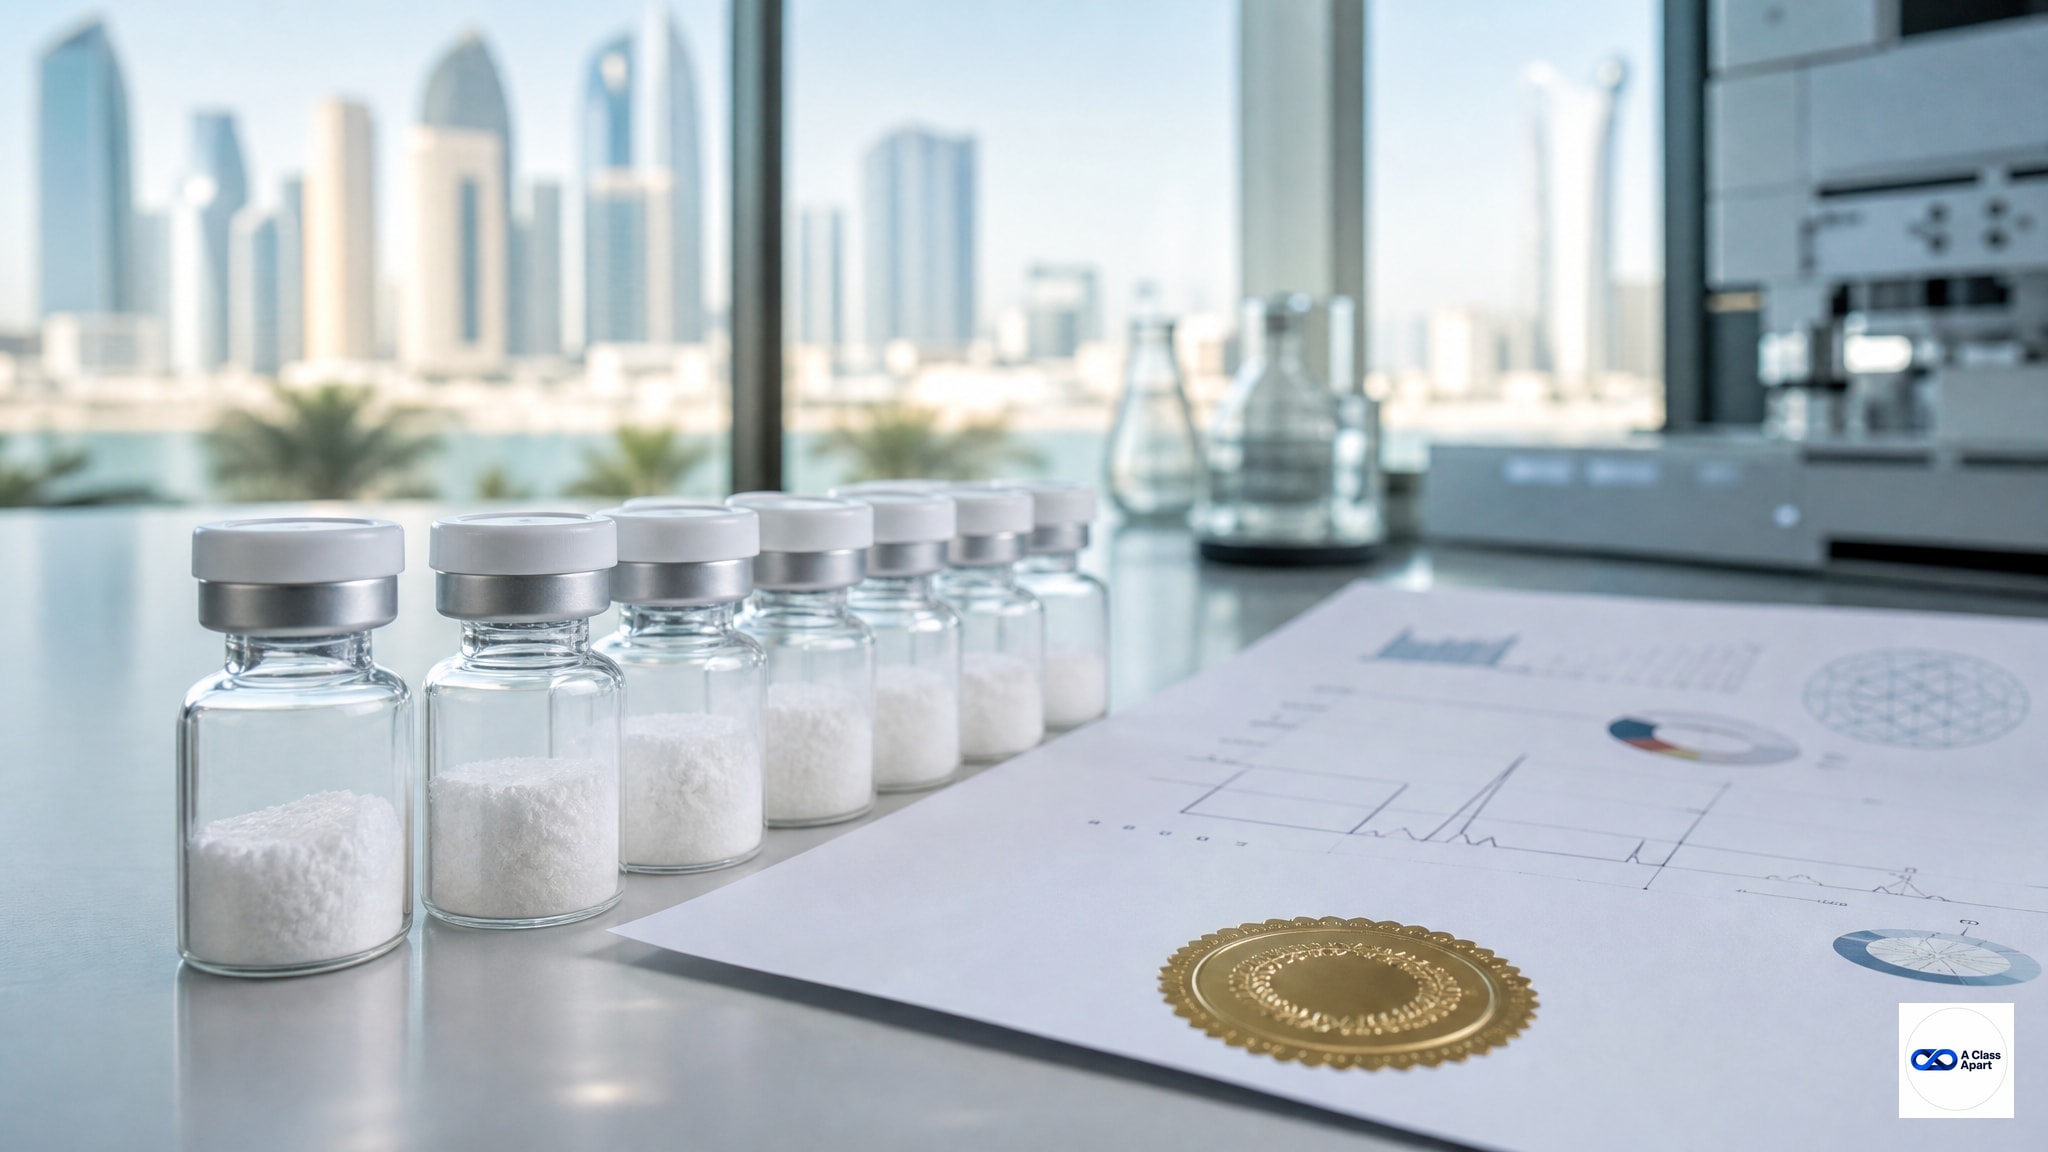
A legitimate COA for a research peptide is a document of record, not a summary sheet. The minimum data it should carry:
HPLC chromatogram, the actual trace, not just a reported percentage. The chromatogram shows peak shape, impurity profile, and baseline noise. A number without the underlying trace is unverifiable.
Purity percentage, calculated from integrated peak areas at 214 nm, with the integration method stated or available on request.
Mass spectrometry spectrum, the actual spectrum or at minimum the observed m/z values and charge states, with the calculated theoretical mass for comparison. A text note reading "MS confirmed" with no data is not MS confirmation.
Batch/lot number, links the COA to a specific synthesis run. Without it, the document cannot be traced.
Synthesis or release date, establishes when the characterisation was performed and informs storage stability calculations.
Molecular formula and theoretical molecular weight, provides the reference against which MS data is evaluated.
A supplier who withholds the raw chromatogram or raw MS spectrum, providing only summary figures, is asking you to trust a number rather than the evidence behind it. That is a quality red flag, not a minor documentation oversight. Fabricated or generic COAs do circulate in the peptide research supply market; a batch-specific chromatogram with the correct lot number is far harder to falsify than a summary table.
For a detailed breakdown of what a peptide Certificate of Analysis should contain, including how to interpret HPLC integration reports and read ESI-MS output, that resource covers the documentation layer specifically.
A Class Apart provides UAE delivery information and storage guidance. Researchers should confirm the packaging and temperature-handling arrangements required for a specific material before ordering. For researchers sourcing documentation-focused peptides in the UAE, that documentation standard means the purity data you receive is the same data that came off the instrument, traceable, batch-specific, and independently verified.
Peptide quality assurance is not a supplier marketing claim. It is a set of analytical outputs that either exist in verifiable form or do not. The methods described here, HPLC, MS, and where required AAA, are the tools that produce those outputs. Knowing what to ask for, and what the answer should look like, is what separates a well-controlled experiment from one built on an assumption.
Research-use notice: For laboratory research use only. Not for human or veterinary use, and not intended to diagnose, treat, cure, mitigate or prevent disease.
Explore the A Class Apart research catalogue or enquire via WhatsApp on +971 52 627 8691. Free UAE delivery is available on orders from AED 1,000, and payment via WhatsApp can be arranged if preferred.

Comments